Page 1 of 1
How can I overlap two graphs in multi band?
Posted: 30 Aug 2011, 21:11
by joro
How can I overlap two graphs in multi band?
Re: How can I overlap two graphs in multi band?
Posted: 30 Aug 2011, 21:11
by joro
To overlap two graphs, open both the test results. In one of the two test results press the graphs button. you will see that the other test is available for selection. You can add any line from the other test result into the current graph.
Re: How can I overlap two graphs in multi band?
Posted: 15 Mar 2013, 22:57
by joro
Another possibility is to export a graph line to a Limit Line File, which will create a 'Reference line'. The color and description of this reference line can be customized during the export. The created reference line can then be included in other Emission measurements, to have a visually comparison between the two emission measurements.
This functionality is included since the 2013.1.6 release.
Re: How can I overlap two graphs in multi band?
Posted: 02 Apr 2013, 15:05
by afrank
Radimation 5.8.38: To overlap two graphs, open both the test results. In one of the two test results press the graphs button. you will see that the other test is available for selection. You can add any line from the other test result into the current graph.
Radimatio 2013.1.7: Not working in v 2013.1.7.
Re: How can I overlap two graphs in multi band?
Posted: 03 Apr 2013, 07:48
by joro
In 2013.1.7, the overlapping of the graphs should still be possible. It is however possible that due to an issue it is currently not working coorectly as we are expecting. I will try to do it myself, and investigate the issue.
I hope to have an answer later today.
Sent from my HTC Vision Using ForumTouch for Android
Re: How can I overlap two graphs in multi band?
Posted: 03 Apr 2013, 22:30
by joro
I tried to overlap the results of two different emission tests with eachother (in version 2013.1.7). Using the method:
To overlap two graphs, open both the test results. In one of the two test results press the graphs button. you will see that the other test is available for selection. You can add any line from the other test result into the current graph.
In my situation it was working correctly (see the screenshot below). The only potential problem I observed, that it could be a problem if the description of both emission tests is the same. Is the description for both tests the same in your situation?
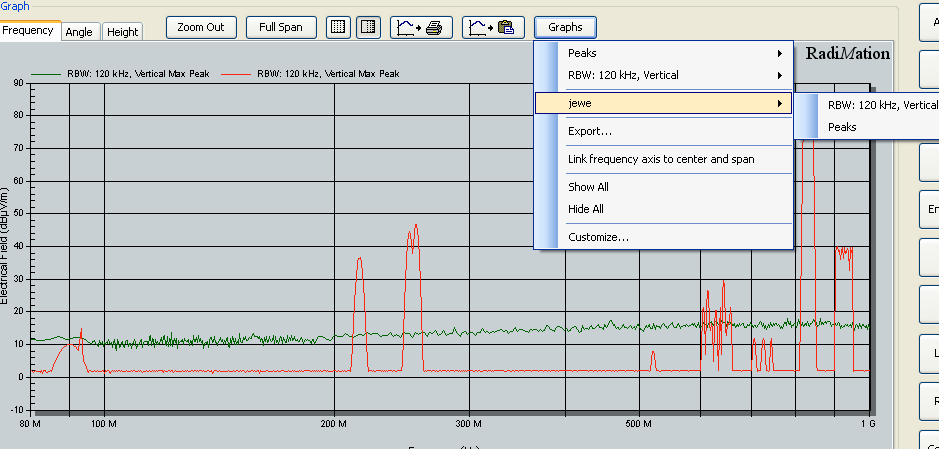
- Overlapping graphs from two different emission tests
- overlapping_graphs.png (33.03 KiB) Viewed 14198 times